
Collect traces, logs, and custom metrics from your Google Cloud Run services with Datadog
Learn how to instrument your Cloud Run workloads to directly collect traces, logs, and custom metrics and visualize your telemetry using the Serverless View.
 Cloud Security Trends & Challenges: Complete GuideCybersecurity Exchange
 Digital Forensics & Emerging Technologies GuideCybersecurity Exchange
 Trigger automation - MintlifyMintlify
 Redis Cloud PrivateRedis
 Plumsail Documents: Zapier spp spotlightZapier
 Meet Zapier Central's Chrome extensionZapier
 How to connect Google Sheets to NotionZapier
 This Week in Programming: Who's Headed to KubeCon?Thenewstack
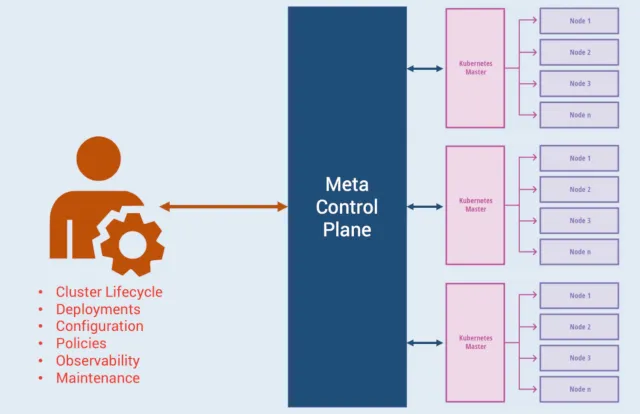 Google Anthos from the Eyes of a Kubernetes DeveloperThenewstack
 Puppet’s New Mission: Automating Cloud Native InfrastructureThenewstack
 Security Considerations for API-Driven Apps Deployed to CloudThenewstack
 Oso Unbundles Security AuthorizationThenewstack
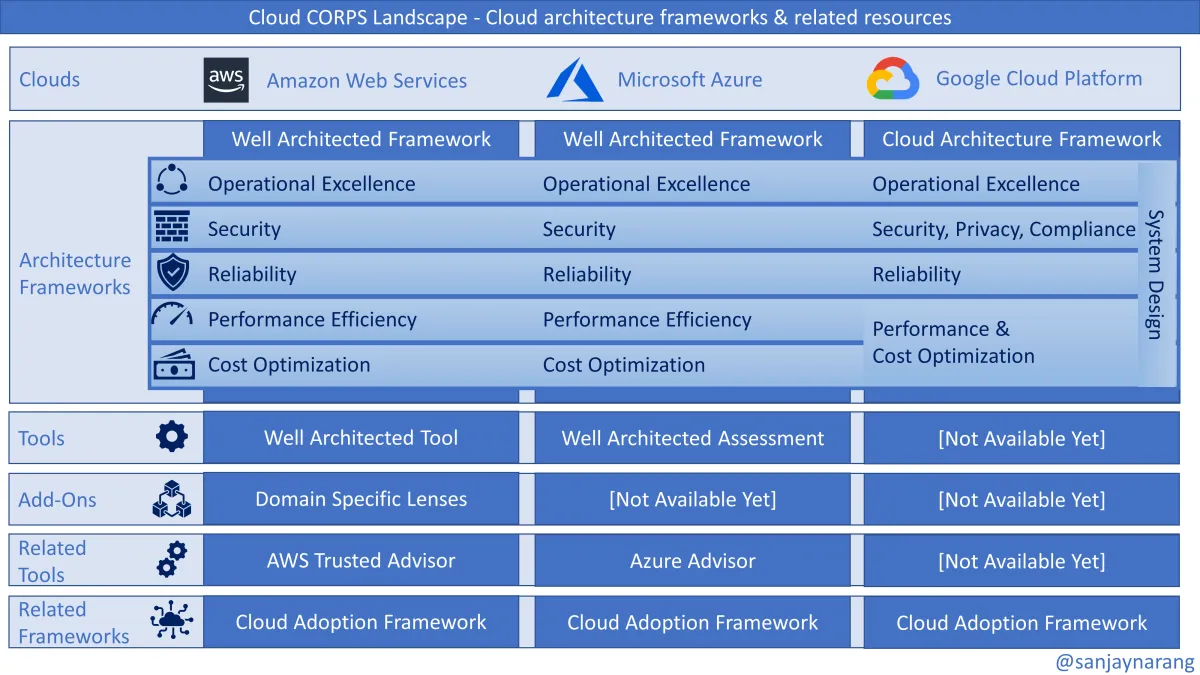 Introducing CORPS: The 5 Pillars for a Robust Cloud Architecture FrameworkThenewstack
 Cloud Systems: Deploying to Amazon ECSPulumi
