
Monitoring Kubernetes with Datadog Distribution of the OpenTelemetry (DDOT) Collector
Kubernetes environments benefit substantially from comprehensive observability, as collecting and correlating these telemetry signals allows teams to proactively address performance issues, reduce mean time to resolution, and keep applications running reliably.It’s straightforward to monitor Kubernetes using the Datadog Agent.
 10 best AI observability tools for monitoring and evaluating agents in 2026Mintlify
 Local Kubernetes Development Using Minikube and Redis EnterpriseRedis
 How Argo CD and OpenShift Enable GitOps for DevelopersThenewstack
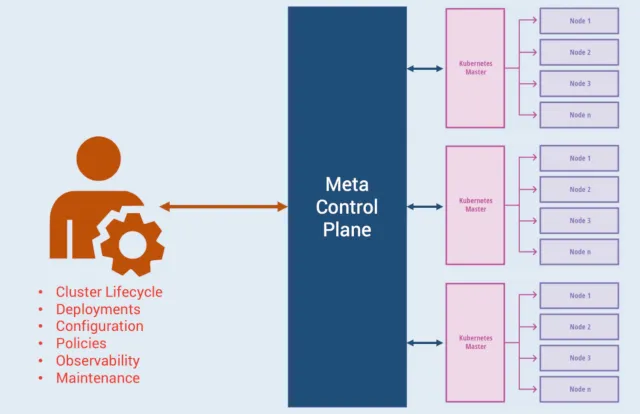 Google Anthos from the Eyes of a Kubernetes DeveloperThenewstack
 Security Considerations for API-Driven Apps Deployed to CloudThenewstack
 AWS Enterprise Container Management with PulumiPulumi
 Supporting Kubernetes with Faster, Easier Test EnvironmentsPulumi
 Neo Integrations: MCP Servers and Cloud CLIsPulumi
 Product updates: Datadog integration, lower function latency & moreModal
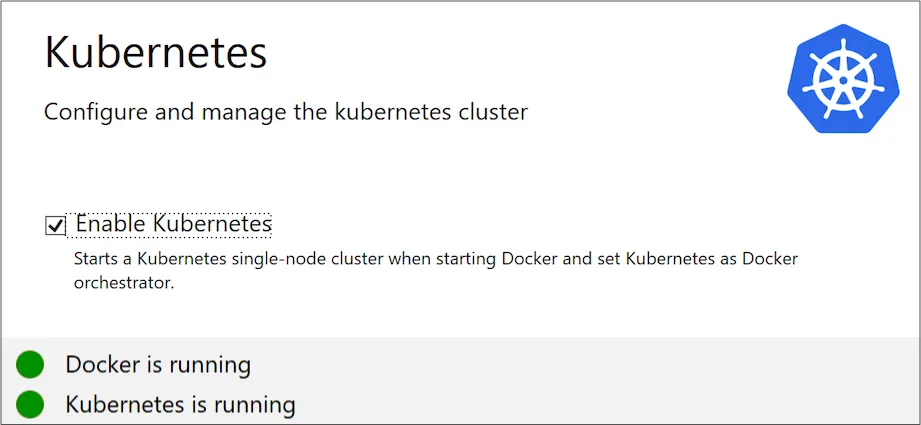 Docker for Windows Desktop with KubernetesDocker
 Using instrumentation librariesOpentelemetry
Configure OBI routes decoratorOpentelemetry
Install the Collector on macOSOpentelemetry
ArchitectureOpentelemetry
Using instrumentation librariesOpentelemetry
Configure OBI routes decoratorOpentelemetry
Install the Collector on macOSOpentelemetry
ArchitectureOpentelemetry
