
R tip: How to create easy interactive scatter plots with taucharts
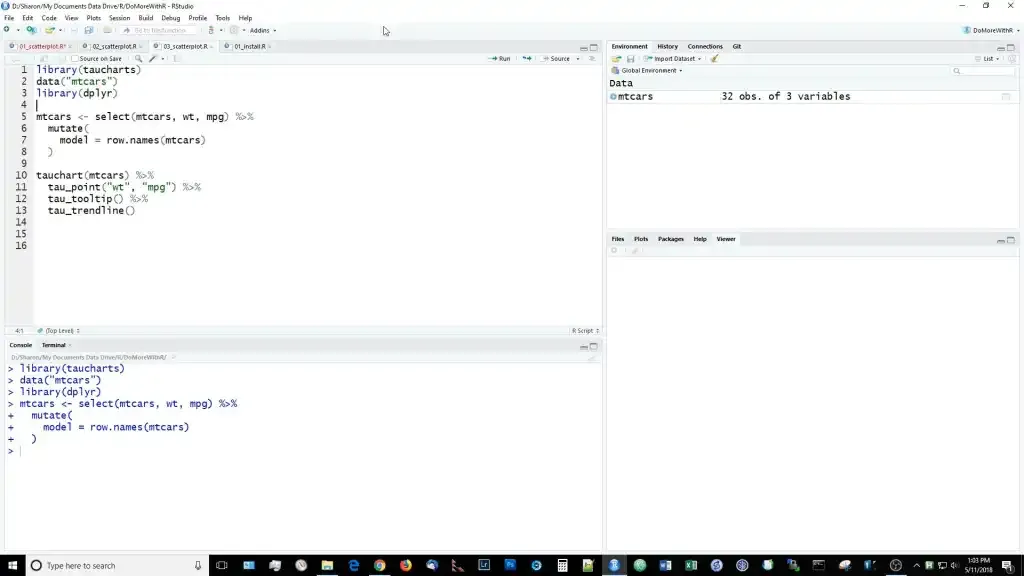
In this first episode of Do More with R, Sharon Machlis, director of Editorial Data & Analytics at IDG Communications, demonstrates how easy it is to use the R language to create an interactive scatter plot with multiple trendline choices
 Microsoft shuffles more of its senior AI leadershipcomputerworld.com
 Google adds end-to-end Gmail encryption to Android, iOS devices for enterprisescomputerworld.com
 Does the Cloud Free up the Enterprise?computerworld.com
 How to Buy a Back to School Laptopcomputerworld.com
 Universities scramble to prep tech for fallcomputerworld.com
 Power-user tips for the Chrome Android browsercomputerworld.com
 Create assistant message - MintlifyMintlify
 WooCommerce: App spotlightZapier
 Meet Zapier Central's Chrome extensionZapier
 Get email alerts for Facebook Messenger messagesZapier
 Flockport: Time to Start All Over Again and Return to LXC ContainersThenewstack
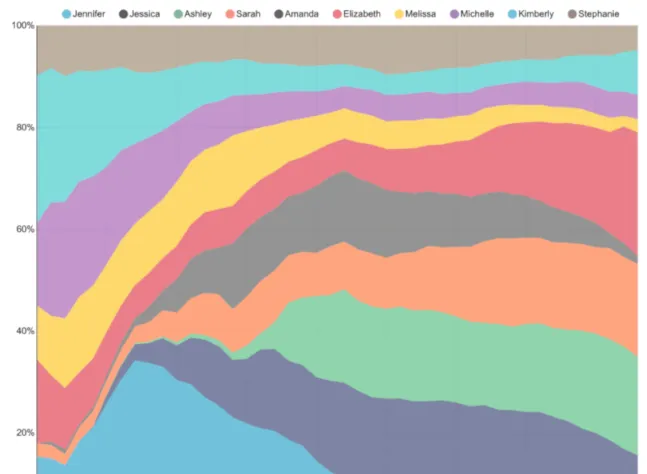 Explore and Visualize Data the Apache Superset WayThenewstack
 Supporting Kubernetes with Faster, Easier Test EnvironmentsPulumi
 4 Ways to Animate the Color of a Text Link on HoverCss Tricks
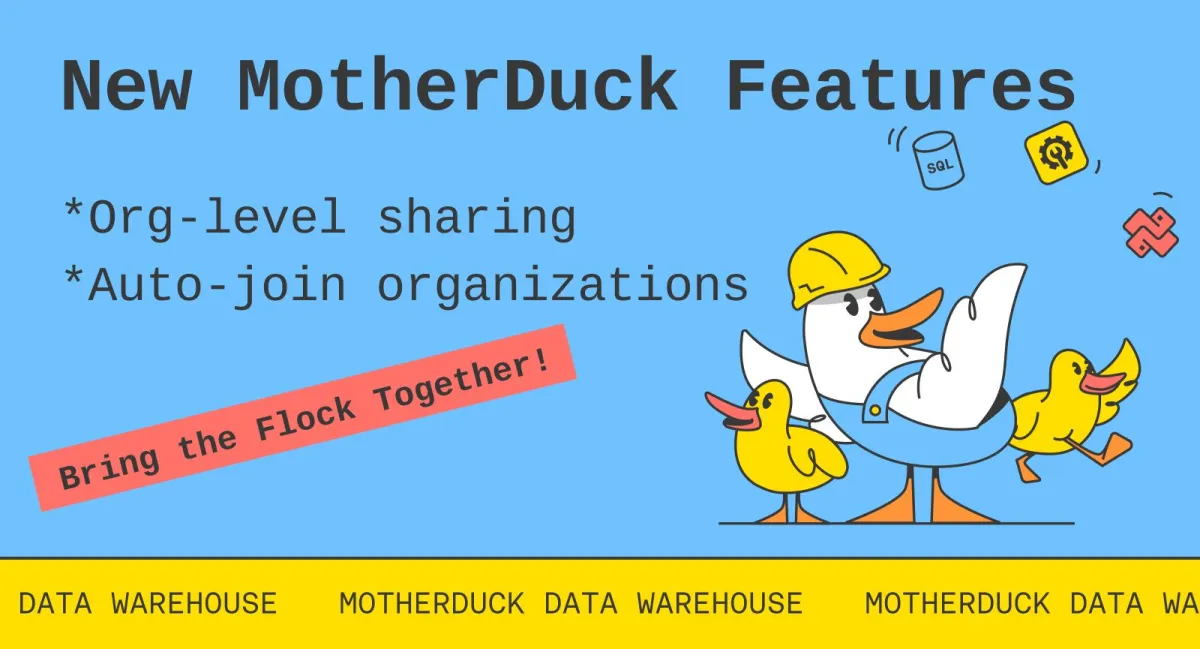 New Collaboration Features: Org-level sharing and Auto-JoinMotherduck
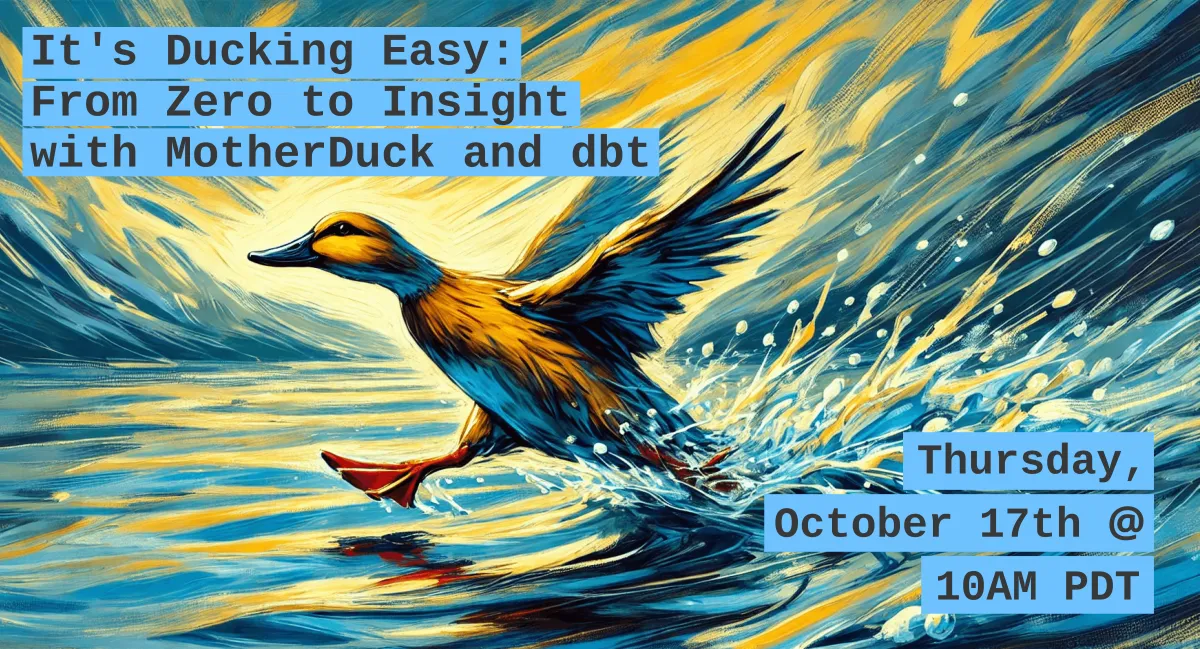 It's Ducking Easy: From Zero to Insight with MotherDuck and dbtMotherduck
 How to Use Your Own RegistryDocker
 The Livecycle Docker Extension: Instantly Share Changes and Get Feedback in ContextDocker
 A prompt guide to get the most out of HeyGen's new Video AgentHeygen
 How to Create a Spokesperson on AI Video GeneratorHeygen
