
Visual Storytelling: The Little Prince and Our New Embedded Charts
Visual Storytelling: The Little Prince and Our New Embedded Charts - Google Developers Blog Visual Storytelling: The Little Prince and Our New Embedded Charts JUNE 29, 2010 Share Facebook Twitter Linked In Mail “My drawing was not a picture of a hat. It was a picture of a boa constrictor digesting an elephant.”The Little Prince, Chapter 1 - Antoine de Saint-Exupéry Drawing Number One Inspired by the Little Prince an…

 Reminder: ClientLogin Shutdown scheduled for April 20, 2015developers.googleblog.com
 Retiring the Email Migration APIdevelopers.googleblog.com
 Google Summer of Code now open for student applicationsdevelopers.googleblog.com
Publishing Google Docs add-ons for domain-wide installationdevelopers.googleblog.com
Google Summer of Code now open for student applicationsdevelopers.googleblog.com
Publishing Google Docs add-ons for domain-wide installationdevelopers.googleblog.com
 DevFest 2018 Kickoff!developers.googleblog.com
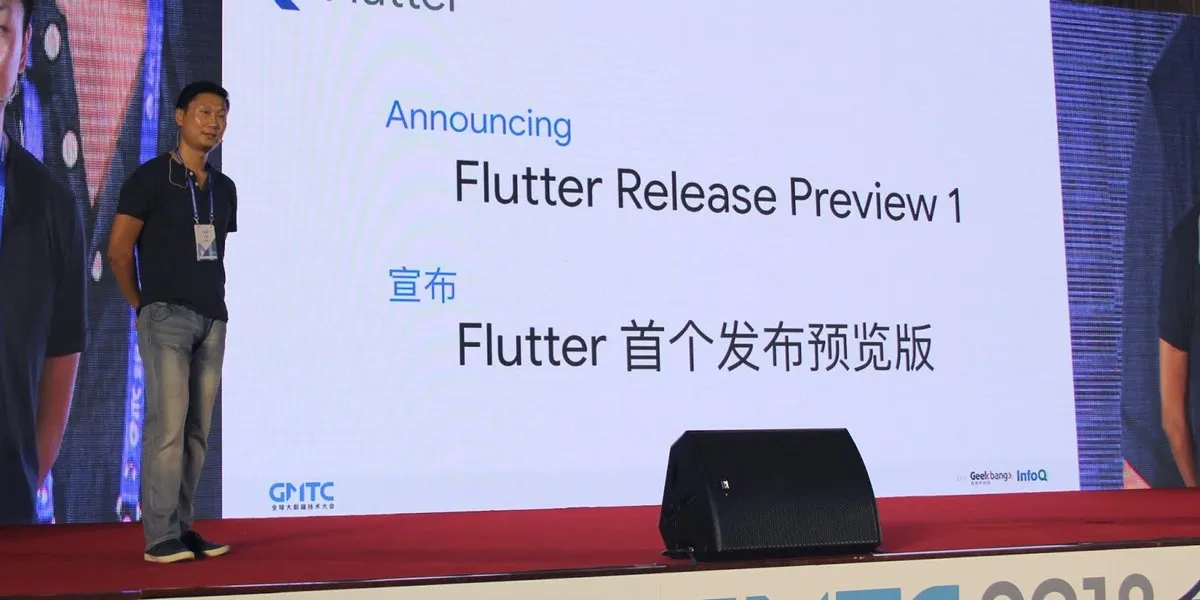 Flutter Release Preview 1: Live from GMTC in Beijingdevelopers.googleblog.com
 Pulumi ESC Table Editor Now Supports Dynamic Credential and Secret IntegrationsPulumi
 CSS Hell | CSS-TricksCss Tricks
 Creating Color Themes With Custom Properties, HSL, and a Little calc()Css Tricks
 The Serverless Backend for Analytics: Introducing MotherDuck’s Native Integration on VercelMotherduck
 An Introduction to Using Linux in Embedded SystemsThenewstack
 Defining “View Source”Css Tricks
 Quacking the Code to Multi-Tenant Embedded Analytics with GoodData & MotherDuckMotherduck
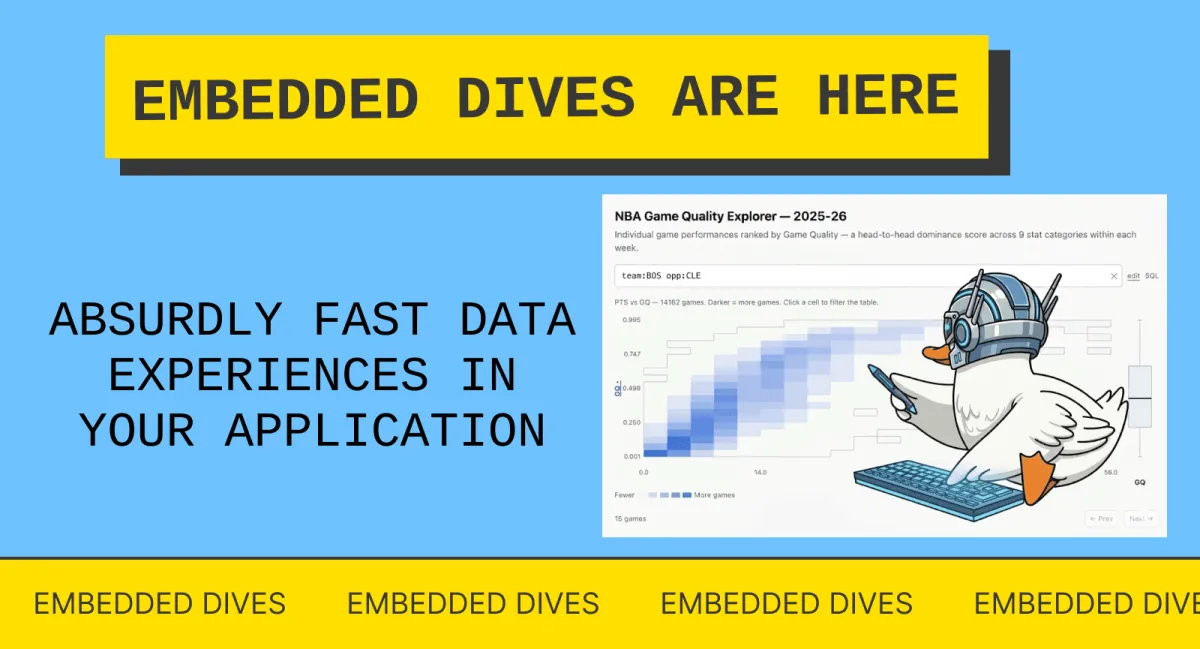 Introducing Embedded DivesMotherduck
 Streamline NGINX Configuration with Docker Desktop ExtensionDocker
 Images and embeds - MintlifyMintlify
 Biome Announces v2.0 Beta with Plugin System and Type Information SupportSocket
 Conductor: Why We Migrated from Kubernetes to NomadThenewstack
 Announcing MotherDuck General Availability: Data Warehousing with DuckDB at ScaleMotherduck
 Observability as a Developer SuperpowerPulumi
