
Scatter Chart - Atlas Charts - MongoDB Docs
Explore how to use scatter charts to plot data points with optional encoding channels for size, color, and shape to represent additional data dimensions.
 Docs-as-code solutions for API teams: how to choose the right platform in 2026Mintlify
 Redirects - MintlifyMintlify
 Breaking down common documentation mistakesMintlify
 Mintlify Alternatives: What to Consider (and Why There's No True Substitute)Mintlify
 AWS Enterprise Container Management with PulumiPulumi
 AGENTS.md outperforms skills in our agent evalsVercel
 API docs with Git integration: best platforms and workflows in 2026Mintlify
 Google Workspace automationZapier
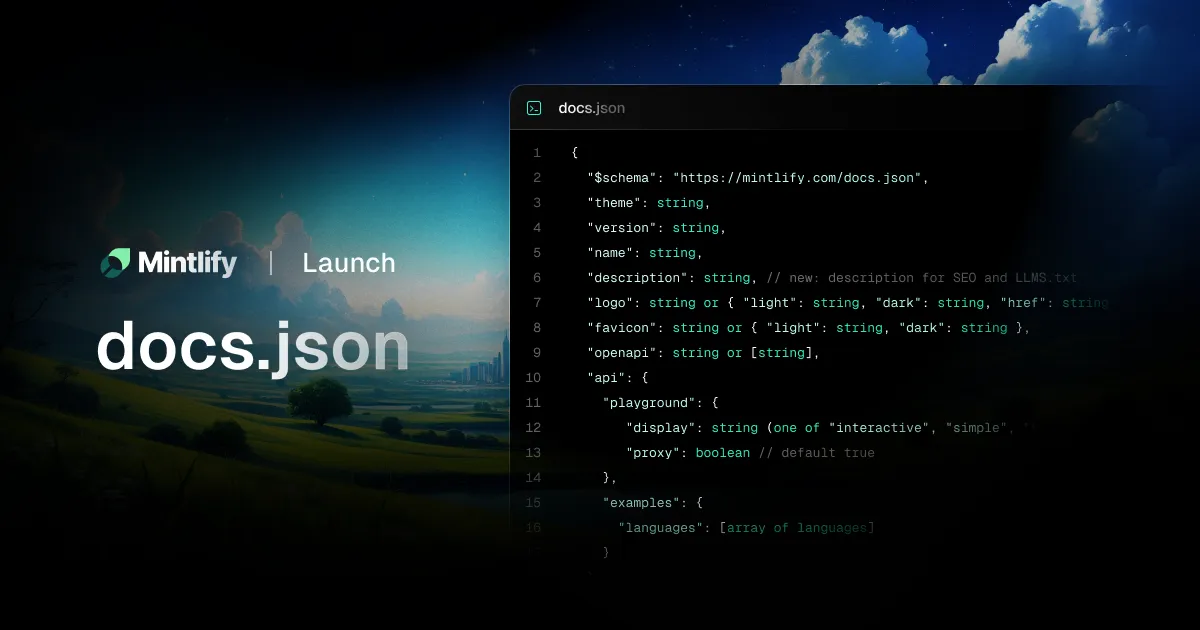 Refactoring mint.json into docs.jsonMintlify
 How to write technical documentation that developers actually useMintlify
 Mintlify CLI - MintlifyMintlify
 No More Zapier Timeouts: Transcribe Large Audio Files with Deepgram and Zapier’s WebhooksDeepgram
 Retool and MongoDB partner to make it easier to build securely on AtlasRetool
 Making the Most of Your Docker Hardened Images Enterprise Trial - Part 1Docker
