
Diagnose runtime and code inefficiencies in production by using Continuous Profiler’s timeline view
Learn how you can use Continuous Profiler’s new timeline view to investigate the causes behind application performance issues.
 Docs-as-code solutions for API teams: how to choose the right platform in 2026Mintlify
 Mintlify Alternatives: What to Consider (and Why There's No True Substitute)Mintlify
 10 best AI observability tools for monitoring and evaluating agents in 2026Mintlify
 Build a Presentation Coaching Application with Recall - Deepgram Blog ⚡️Deepgram
 Top 3 Use Cases for Speech-to-Text in Gaming - Deepgram Blog ⚡️Deepgram
 No Code Transcription: Simplifying Workflows with Deepgram and Make.comDeepgram
 Local Kubernetes Development Using Minikube and Redis EnterpriseRedis
Six Things to Consider When Using Redis on HerokuRedis
Local Kubernetes Development Using Minikube and Redis EnterpriseRedis
Six Things to Consider When Using Redis on HerokuRedis
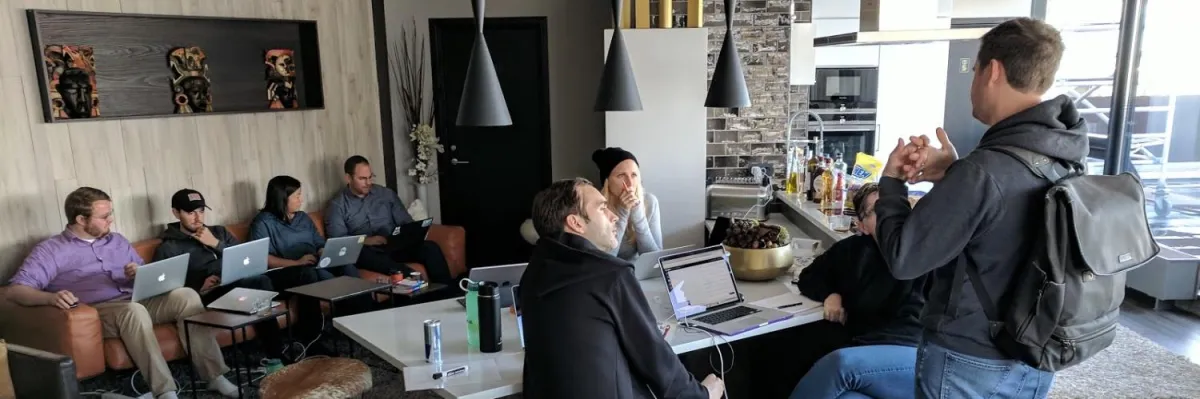 Customer.io Automatically Standardizes Form Submissions for ReportingZapier
 How automation helped us get better customer reviewsZapier
 Oso Unbundles Security AuthorizationThenewstack
 Pulumi ESC Table Editor Now Supports Dynamic Credential and Secret IntegrationsPulumi
 Empower Your Team with Policy as CodePulumi
 How We Eliminated Long-Lived CI Secrets Across 70+ ReposPulumi
