
Enable preconfigured alerts with Recommended Monitors
Betsy Sallee Datadog’s more than 1,000 integrations collect monitoring data from across your entire stack, giving you full visibility into the health and performance of your applications and infrastructure.
 Get email alerts for Facebook Messenger messagesZapier
 How Argo CD and OpenShift Enable GitOps for DevelopersThenewstack
 KAUST and Cerebras Named Gordon Bell Award Finalist for Solving Multi-Dimensional SeismicCerebras
 Docker at Cloud Expo Asia: GenAI, Security, and New InnovationsDocker
 Two-factor AuthenticationVercel
 GPU Memory Snapshots: Supercharging sub-second startupModal
 HTML | KotlinKotlinlang
 Achieve security and compliance goals with policy guardrails in Docker ScoutDocker
 PCI compliance for ecommerceVercel
 Prometheus Alerts RunbooksOpentelemetry
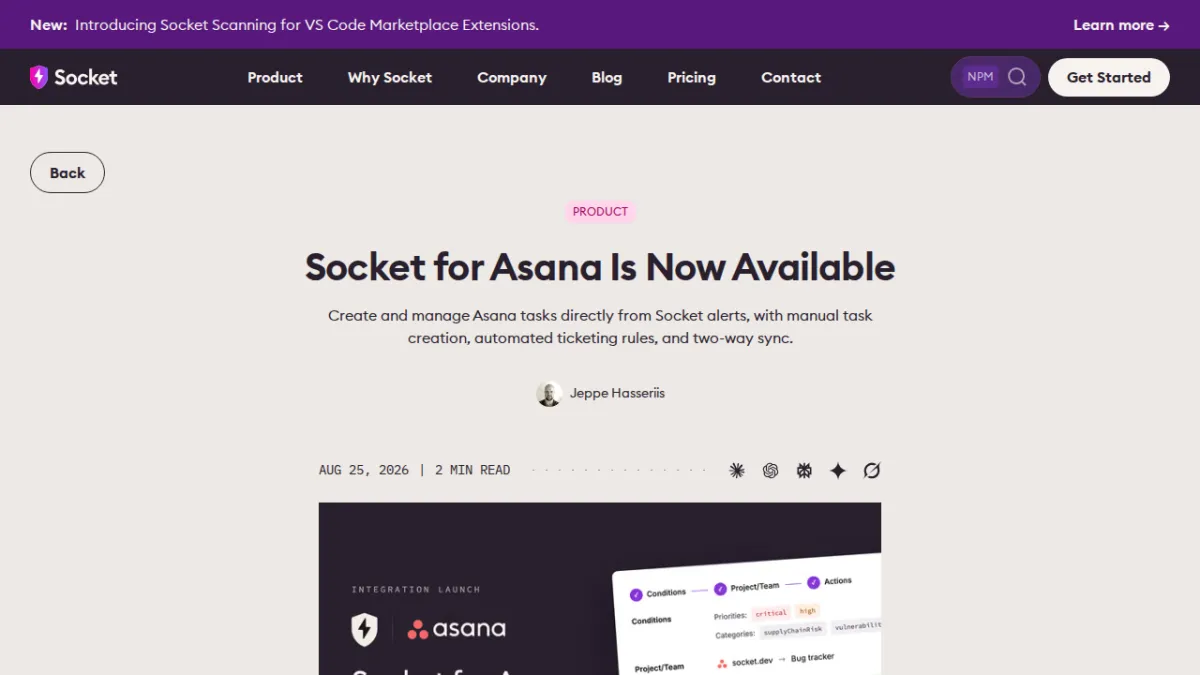 Socket for Asana Is Now AvailableSocket
 Announcing: Pulumi Deployments, YAML GA, Arch TemplatesPulumi
 Pulumi ESC: Open ApprovalsPulumi
 Introducing Usage Limits for Pulumi NeoPulumi
