
From zero to traces: Choosing the right APM instrumentation method for your stack
Learn why Single Step Instrumentation is our default recommendation for setting up APM traces, and when to consider other methods.
 Docs-as-code solutions for API teams: how to choose the right platform in 2026Mintlify
 Breaking down common documentation mistakesMintlify
 6 ways to use the Zapier Zoho CRM integrationZapier
 Puppet’s New Mission: Automating Cloud Native InfrastructureThenewstack
 Selecting the Right Database for Your MicroservicesThenewstack
 From zero to Go: launching on the Google homepage in 24 hours - The Go Programming LanguageGo
 PostgreSQL and Ducks: The Perfect Analytical PairingMotherduck
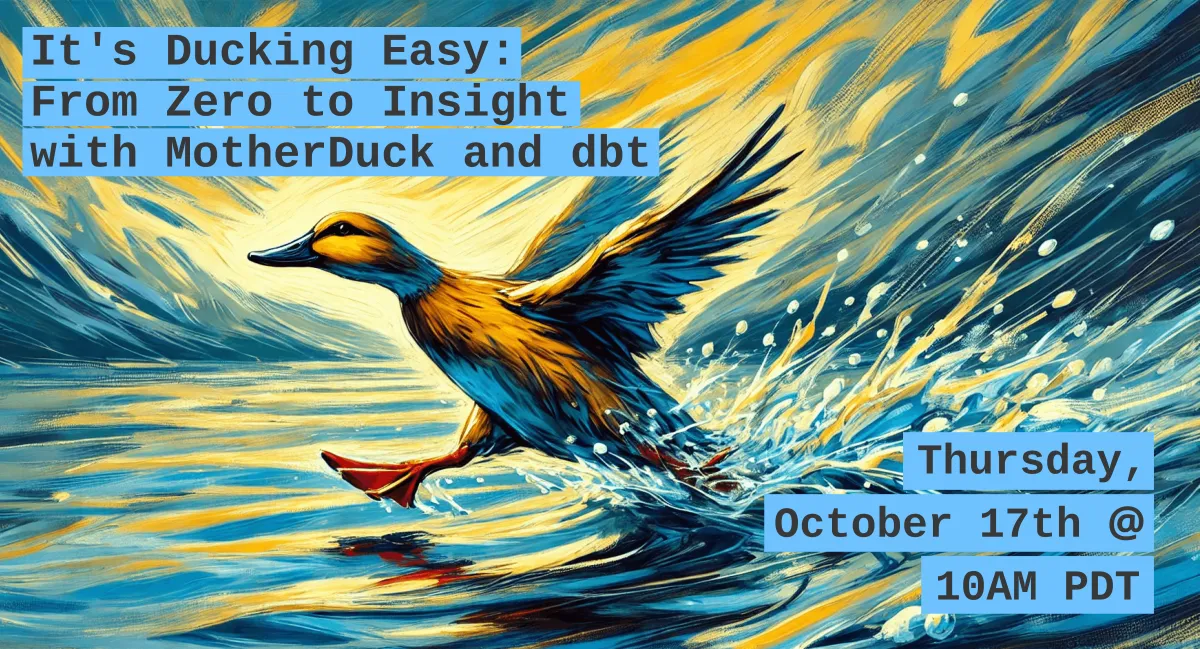 It's Ducking Easy: From Zero to Insight with MotherDuck and dbtMotherduck
 Revisiting Docker Hub Policies: Prioritizing Developer ExperienceDocker
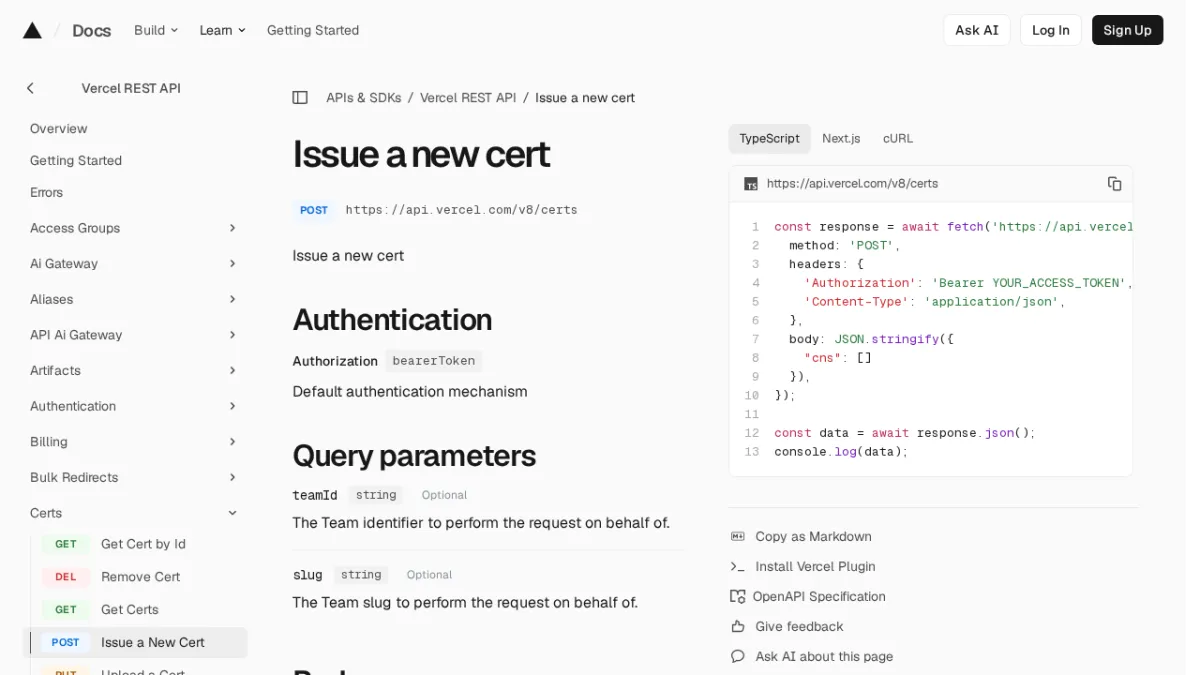 Issue a new certVercel
 Autogenerating API documentation from OpenAPIMintlify
 Using instrumentation librariesOpentelemetry
.NET Framework instrumentation configurationOpentelemetry
TroubleshootingOpentelemetry
Using instrumentation librariesOpentelemetry
.NET Framework instrumentation configurationOpentelemetry
TroubleshootingOpentelemetry
