
How Medium monitors DynamoDB performance
Jean-Mathieu Saponaro This post is the last of a 3-part series on how to monitor DynamoDB performance.
 The Proven Redis PerformanceRedis
 How to serve trillions of tokens for trillion-parameter coding agentsModal
 Jetpack Boost Handles Critical CSS For YouCss Tricks
 Real-Time Computational Physics with Wafer-Scale Processing [updated]Cerebras
 Meta AI Video Generator's ImpactHeygen
 How the world’s biggest YouTuber served millions of users on VercelVercel
 The Noise Reduction Paradox in Speech-to-Text AccuracyDeepgram
 The Cost of Javascript Frameworks | CSS-TricksCss Tricks
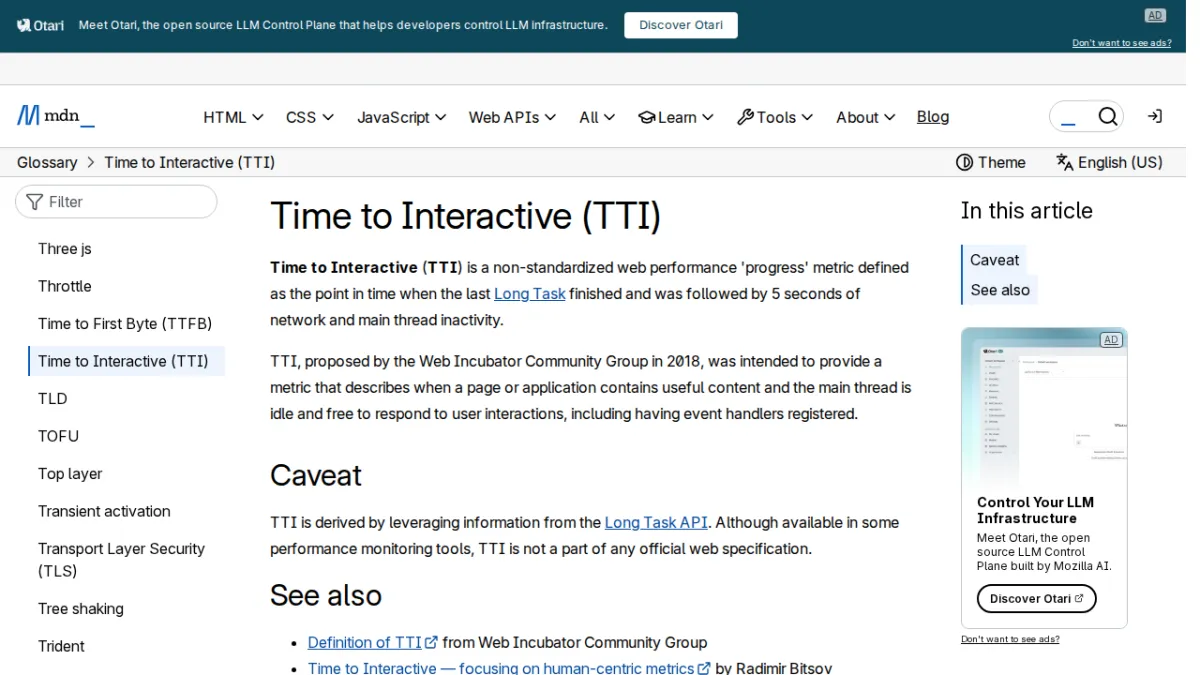 Time to Interactive (TTI) - GlossaryDeveloper Mozilla
 Cerebras Systems and National Energy Technology Laboratory Set New Milestones for High-PerformanceCerebras
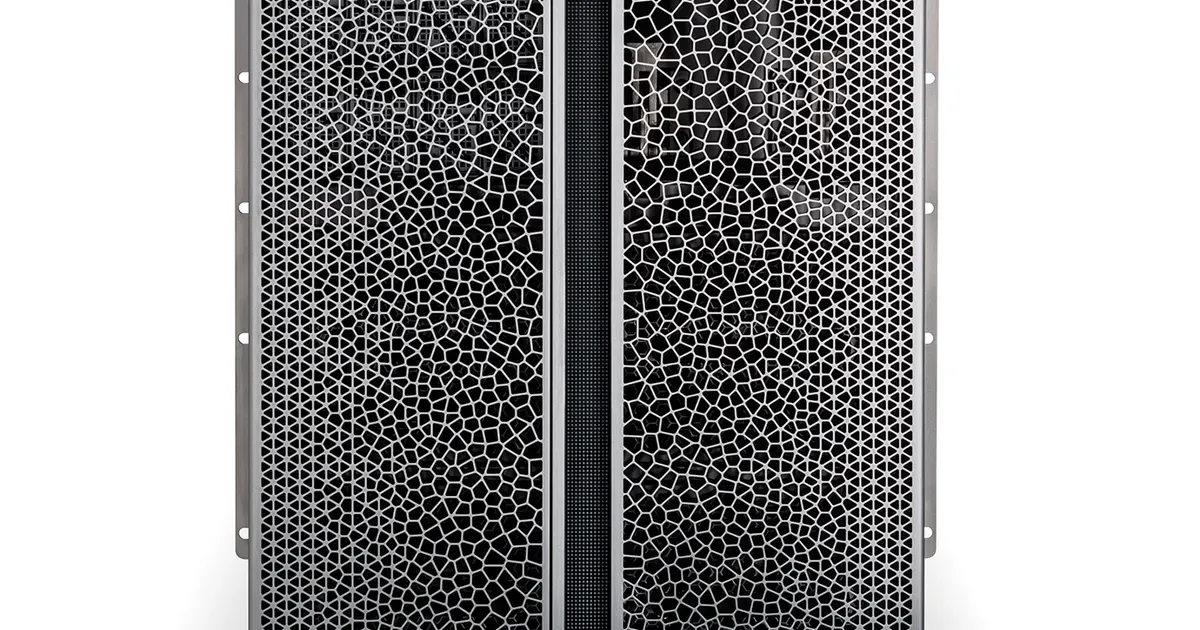 Cerebras Systems Sets Record for Largest AI Models Ever Trained on A Single Device - CerebrasCerebras
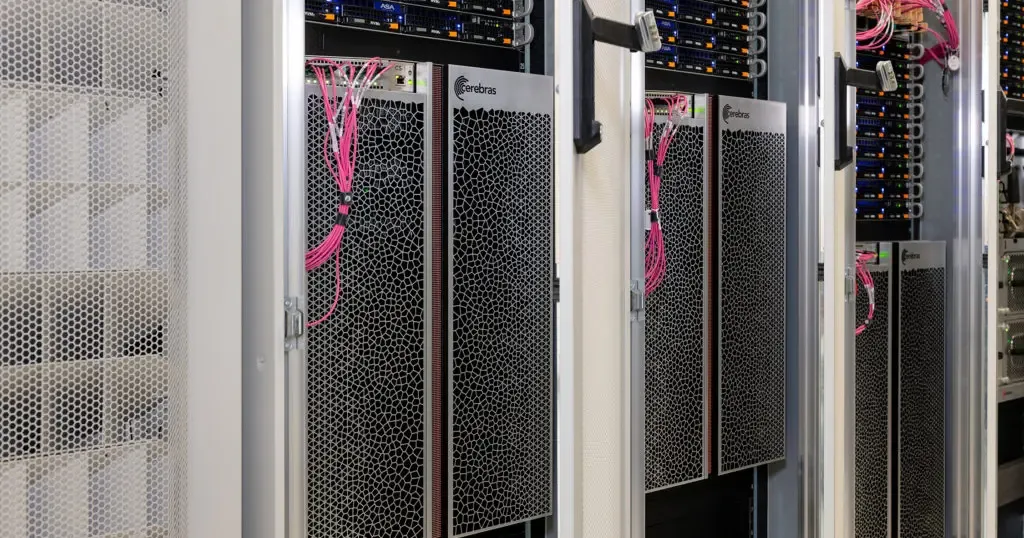 Cirrascale Cloud Services® and Cerebras Systems Announce Availability of Cerebras Cloud @ CirrascaleCerebras
 Introducing CDN Vary Cache By Cookie ValueBunny
 Building a Redis admin panel in RetoolRetool
